chart-demo
CHART DEMO — the consumer that makes `kits/chart` a library rather than a claim.
7 source files1 test file
Get it
$ osy init chart-demo
$ osy launch
The app
app.osy8 lines
// CHART DEMO — the consumer that makes `kits/chart` a library rather than a claim.
app ChartDemo {
  use Osyrin.Charts@1;

  model "model/**/*.osy";
  tests "tests/**/*.test.osy";
}
model/data.osy55 lines
// The data behind /live — one narrow entity, so the page is about the LIVE QUERY and not about a schema.

entity Reading {
  /// Which series this cell belongs to — the string that becomes the mark's label.
  [MaxLength(40)] string Series;
  /// Position along the category axis.
  int Slot;
  double Value;

  security {
    allow read when IsAnonymous || IsAuthenticated;
    allow create when IsAnonymous || IsAuthenticated;
    allow update when IsAnonymous || IsAuthenticated;
    allow delete when IsAnonymous || IsAuthenticated;
  }
}

/// Seed two series on first open, so the page has something to draw before anyone presses anything.
[AllowAnonymous]
void SeedReadings() {
  if (Reading.Any()) { return; }
  var north = [12.0, 19.0, 15.0, 22.0, 28.0, 24.0];
  var south = [8.0, 11.0, 17.0, 14.0, 19.0, 26.0];
  var i = 0;
  foreach (var v in north) {
    new Reading { Series = "North", Slot = i, Value = v };
    i = i + 1;
  }
  i = 0;
  foreach (var v in south) {
    new Reading { Series = "South", Slot = i, Value = v };
    i = i + 1;
  }
  UnitOfWork.Commit();
}

/// Append one reading to each series, continuing from the last slot.
[AllowAnonymous]
void AppendReading(double north, double south) {
  // `Max` answers null over no rows, so the `Any()` guard does not make it non-nullable — this compiler has no
  // flow narrowing. `?? -1` gives absence a value, and the `+ 1` then starts the first series at 0 as before.
  var next = (Reading.Max(r => r.Slot) ?? -1) + 1;
  new Reading { Series = "North", Slot = next, Value = north };
  new Reading { Series = "South", Slot = next, Value = south };
  UnitOfWork.Commit();
}

/// Drop everything and re-seed — so the page can be put back to a known state without a restart.
[AllowAnonymous]
void ResetReadings() {
  foreach (var r in Reading.ToList()) { r.Delete(); }
  UnitOfWork.Commit();
  SeedReadings();
}
model/theme.osy137 lines
// THE SHARED DEMO THEME — canonical copy. Every demo listed in `DemoSharedThemeTests` holds a
// byte-identical `model/theme.osy`, and that test is what keeps them identical.
//
// ⚑ EVERY COLOUR HERE SHADOWS A TOKEN THE KIT ALREADY DECLARES, and that is the whole point.
//   The themes this replaced declared a PARALLEL palette — `Surface0/1/2`, `TextPrimary`,
//   `FillAccent/Success/Warning/Danger` — names `Osyrin.Ui` has never heard of. So the kit's own
//   `Primary`, `Success`, `Warning` and `Danger` stayed at their defaults in six demos: the moment
//   one of them reached for a kit control, that control painted itself indigo next to the demo's
//   blue. `FillAccent` was declared in all six and referenced by NONE — an accent colour that
//   existed only in the theme file.
//
// So the rule for a demo theme is: SHADOW a kit token, never invent a second name for it. A name
// the kit does not have (`Radius.Card`) is a real extension and fine; a second spelling of one it
// does have (`TextPrimary` for `OnBg`) is how an app ends up with two of everything.
//
// Excluded by design — these five own their look and must NOT adopt this file: arcade, ember,
// motion, gestures (each demonstrates a visual world) and Apps/recall-osy.

theme Demo {

  Colors {
    // A deep petrol blue, deliberately not the kit's indigo (#4F46E5) — a demo should look like a
    // considered app rather than an unstyled one, and the two should be distinguishable on sight.
    // It is the one saturated colour on the page; everything else is warm neutral, which is what
    // keeps "distinct" from turning into "loud".
    Primary   = Modes.Of(light: Palette.From("#125E7A"), dark: Palette.From("#57B8D6"));
    OnPrimary = Modes.Of(light: "#FFFFFF", dark: "#06181F");

    Bg      = Modes.Of(light: "#FAF9F7", dark: "#101317");   // the page — a touch warm, so cards read as lifted
    Surface = Modes.Of(light: "#FFFFFF", dark: "#171C22");   // a card, a row, a lane
    Muted   = Modes.Of(light: "#EFEEEA", dark: "#1E242B");   // an inline notice, a disabled field
    Border  = Modes.Of(light: "#E4E2DC", dark: "#28303A");

    OnBg          = Modes.Of(light: "#14181D", dark: "#E7EBF0");
    OnSurface     = Modes.Of(light: "#14181D", dark: "#E7EBF0");
    TextSecondary = Modes.Of(light: "#59626D", dark: "#9BA6B3");   // labels, timestamps, captions
    TextMuted     = Modes.Of(light: "#7C848E", dark: "#7E8894");   // the quietest text on the page

    Success = Modes.Of(light: Palette.From("#1D7A4C"), dark: Palette.From("#4EC98A"));
    Warning = Modes.Of(light: Palette.From("#B26A00"), dark: Palette.From("#E0A343"));
    Danger  = Modes.Of(light: Palette.From("#C1352B"), dark: Palette.From("#F0736A"));
  }

  // Names the kit does not have, so these are extensions rather than second spellings.
  Radius { Control = "8px"; Card = "12px"; }

  // ⚑ THE FONTS ARE WHAT MAKE THIS READ AS A DESIGNED APP RATHER THAN A DEFAULT ONE, and `Sans`
  //   shadows the kit's own token — so every kit control picks it up with no page edit at all.
  //   Both faces are vendored per app under `model/fonts/` and pinned in `osyrin.lock` (`osy font
  //   add`), because a webfont a page merely NAMES is a webfont that silently falls back.
    //   Only the faces the app SHIPS are named here — Mono is left at the kit default because no
  //   demo renders code, and naming an unshipped family is a silent fallback.
  //   Geist for the UI: a neutral grotesque with real character at small sizes, which is where a
  //   dense LOB screen lives. Fraunces for display: a warm variable serif, used ONLY on a page
  //   title. The pairing is the whole look — one voice for reading, one for announcing.
  Font {
    Sans    = "Geist, ui-sans-serif, -apple-system, \"Segoe UI\", Roboto, system-ui, sans-serif";
    Serif   = "Fraunces, \"Iowan Old Style\", Palatino, Georgia, ui-serif, serif";
  }

  FontSize   { Caption = "12px"; Body = "14px"; Subhead = "17px"; Title = "26px"; }
  FontWeight { Regular = 400; Medium = 500; Semibold = 600; }

  // ── APP EXTENSIONS ─────────────────────────────────────────────────────────────────────────────
  // Everything ABOVE this line is the shared theme, held byte-identical across the demos by
  // `DemoSharedThemeTests`. An app may add tokens BELOW it — a name the kit does not have. It may
  // NOT add a second spelling of one the kit already has; that is the defect this file replaced.
  // ── APP EXTENSIONS ─────────────────────────────────────────────────────────────────────────────
  // Everything ABOVE this line is the shared theme, held byte-identical across the demos by
  // `DemoSharedThemeTests`. An app may add tokens BELOW it — a name the kit does not have. It may
  // NOT add a second spelling of one the kit already has; that is the defect this file replaced.

  // The chart pages name their type sizes for the ROLE on a studio page, which the kit does not have.
  FontSize   { Small = "13px"; Large = "18px"; Hero = "26px"; }   // `Hero`, not `Display` — the
                                                                 // shared theme claims that leaf
                                                                 // for its display FACE.
  // `Regular`, not `Normal`: the kit spells 400 that way, and `Motion.Normal` already
  // claims the leaf name `Normal` across every group.
  FontWeight { Regular = 400; }
}

/// The nav strip every page wears, so the three pages are reachable from each other without a shell.
[AllowAnonymous]
component DemoNav(string here) {
  render {
    Row(gap: 4, wrap: Wrapping.Wrap, mb: 6) {
      NavLink(label: "Gallery", href: "/", here: here);
      NavLink(label: "Palette", href: "/palette", here: here);
      NavLink(label: "Live query", href: "/live", here: here);
    }
  }
}

/// One nav entry. The CURRENT page is marked with weight and ink rather than colour alone — the same rule the
/// legend follows, and for the same reason.
[AllowAnonymous]
component NavLink(string label, string href, string here) {
  render {
    Link(href) {
      Text(label,
           fontWeight: here == href ? FontWeight.Medium : FontWeight.Regular,
           color: here == href ? Colors.OnBg : Colors.Muted);
    }
  }
}

/// A titled panel — every page is a stack of these, so the pages themselves stay readable.
/// (NOT `Section`: that name is already a `fontSize` token, and a component shadowing a token reads as a bug.)
[AllowAnonymous]
component Panel(string title, string note = "") {
  render {
    Stack(gap: 3) {
      Stack(gap: 1) {
        Text(title, fontSize: FontSize.Large, fontWeight: FontWeight.Medium, color: Colors.OnBg);
        if (note != "") { Text(note, fontSize: FontSize.Small, color: Colors.Muted); }
      }
      Slot();
    }
  }
}

/// The page frame — a reading-width centred column, so a chart is judged at a realistic width rather than
/// stretched across a 27" monitor.
[AllowAnonymous]
component DemoPage(string title, string here) {
  render {
    Stack(gap: 8, p: 6, maxW: "980px", mx: "auto", my: 6) {
      Stack(gap: 1) {
        Text(title, fontSize: FontSize.Hero, fontWeight: FontWeight.Medium, color: Colors.OnBg);
        Text("kits/chart — no JavaScript, no bundle, one .osy file", fontSize: FontSize.Small, color: Colors.Muted);
      }
      DemoNav(here: here);
      Slot();
    }
  }
}
model/pages/gallery.osy345 lines
// THE GALLERY — every mark kind the kit ships, at a realistic size, on one page.

using Osyrin.Charts;

[Page("/")]
[Render(CSR)]
[AllowAnonymous]
[Title("Chart gallery")]
component Gallery() {
  string[] months  = ["Jan", "Feb", "Mar", "Apr", "May", "Jun"];
  double[] revenue = [42000.0, 55000.0, 48000.0, 61000.0, 73000.0, 69000.0];
  double[] target  = [40000.0, 50000.0, 55000.0, 60000.0, 65000.0, 70000.0];
  double[] churn   = [3.2, 2.8, 4.1, 3.6, 2.2, 2.9];
  double[] ratio   = [0.12, 0.15, 0.14, 0.19, 0.23, 0.21];
  string[] segments = ["Enterprise renewals", "Mid-market new", "Self-serve", "Partner-sourced", "Reactivations"];
  double[] pipeline = [184000.0, 121000.0, 76000.0, 52000.0, 31000.0];
  double[] lastYear = [150000.0, 138000.0, 61000.0, 44000.0, 39000.0];
  double[] refunds  = [4100.0, 5200.0, 3800.0, 6100.0, 5500.0, 4900.0];
  string[] mixedLabels = ["WWWWW", "iiiiiiiiiiii", "WWWWW", "iiiiiiiiiiii", "WWWWW", "iiiiiiiiiiii"];
  double[] sixOnes      = [1.0, 1.0, 1.0, 1.0, 1.0, 1.0];

  render {
    DemoPage(title: "Chart gallery", here: "/") {
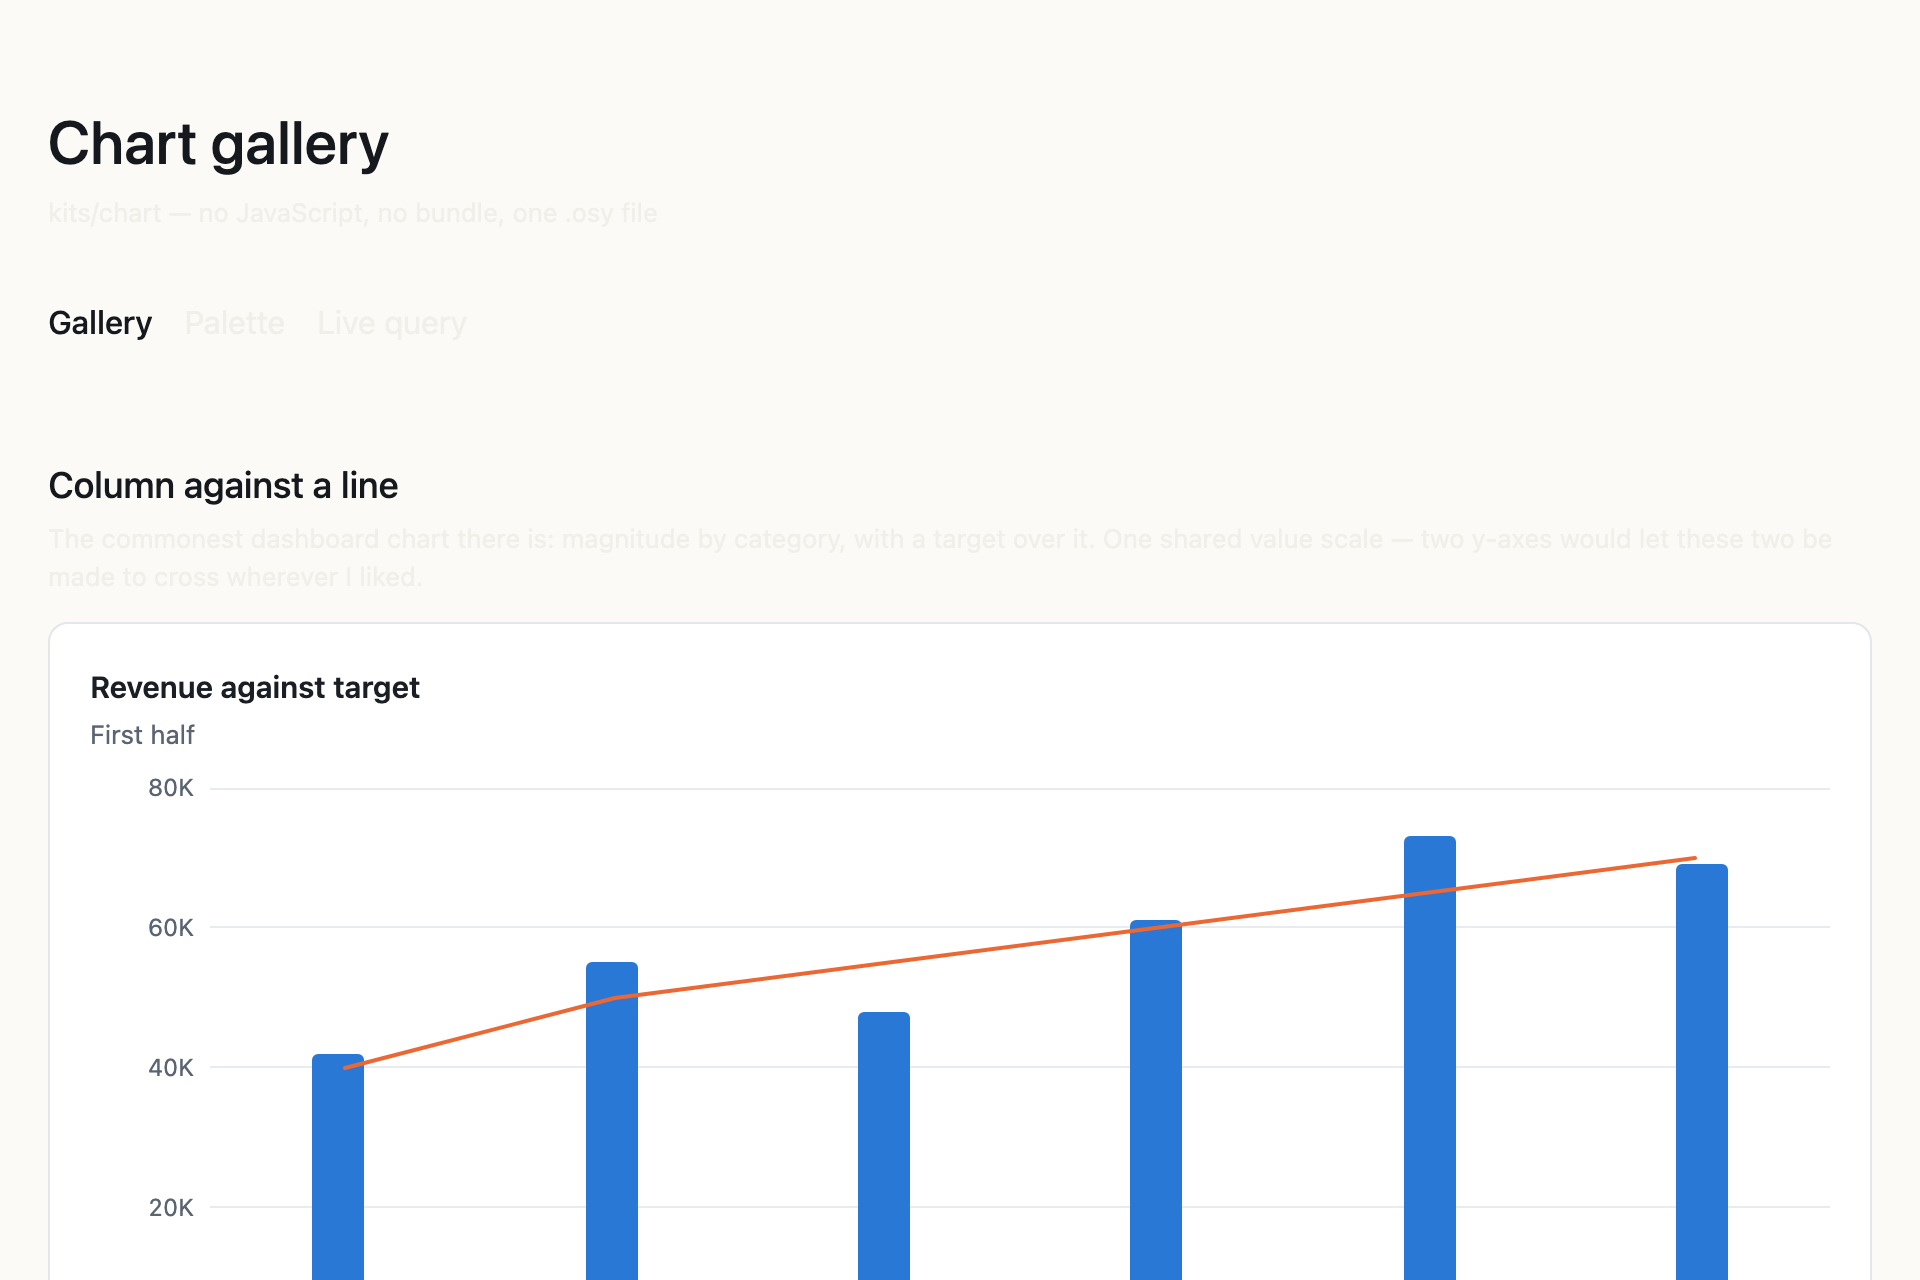
      Panel(title: "Column against a line",
            note: "The commonest dashboard chart there is: magnitude by category, with a target over it. One shared "
                + "value scale — two y-axes would let these two be made to cross wherever I liked.") {
        Chart(title: "Revenue against target", subtitle: "First half", labels: months, height: 280) {
          Column(label: "Revenue", values: revenue);
          Line(label: "Target", values: target);
          Axis(side: AxisSide.Left, ticks: 4);
        }
      }

      Panel(title: "Area",
            note: "One series, because two overlapping washes muddy into a colour that is neither of them. The wash "
                + "is the series hue at low opacity, so it is recessive on a light surface AND on a dark one.") {
        Chart(title: "Revenue", subtitle: "Cumulative shape", labels: months, height: 240) {
          Area(label: "Revenue", values: revenue);
          Axis(side: AxisSide.Left);
        }
      }

      Panel(title: "Scatter",
            note: "Points without a connecting line — for a series whose x-positions are samples rather than a "
                + "sequence. Each point is ≥8px with a surface ring, so it stays a real hit target where points "
                + "overlap.") {
        Chart(title: "Churn %", labels: months, height: 220) {
          Scatter(label: "Churn", values: churn);
          Axis(side: AxisSide.Left, ticks: 3);
        }
      }

      Panel(title: "Values on the marks",
            note: "Off by default: a number on every point is chaos and goes unread. On for a short series where "
                + "the values ARE the story.") {
        Chart(title: "Churn %", labels: months, height: 200, showValues: true) {
          Column(label: "Churn", values: churn);
          Axis(side: AxisSide.Left, ticks: 3);
        }
      }

      Panel(title: "No gridlines",
            note: "`Axis(grid: false)` — a quieter chart that still has its axis, its card and its title. For an "
                + "actual sparkline the answer is now `chrome: Bare` below, which takes all three away.") {
        Chart(title: "Revenue", labels: months, height: 140) {
          Line(label: "Revenue", values: revenue);
          Axis(side: AxisSide.Left, grid: false, ticks: 2);
        }
      }

      Panel(title: "Axis control",
            note: "A title, an explicit domain, a value format and an affix — the four things a real dashboard "
                + "needs before it can show money, percentages or a target band. The format governs the tick "
                + "labels, the hover readout, the on-mark values AND every bar's accessible name from one "
                + "declaration, so the axis and the tooltip cannot disagree.") {
        Stack(gap: 5) {
          Chart(title: "Revenue", subtitle: "£, whole pounds, axis PINNED to 100k — higher than the data would choose", labels: months, height: 240) {
            Column(label: "Revenue", values: revenue);
            Axis(side: AxisSide.Left, title: "GBP", format: "N0", prefix: "£", max: 100000.0, ticks: 4);
          }
          Chart(title: "Churn", subtitle: "one decimal, with a unit suffix", labels: months, height: 200,
                showValues: true) {
            Column(label: "Churn", values: churn);
            Axis(side: AxisSide.Left, title: "Rate", format: "N1", suffix: " %", ticks: 3);
          }
          Chart(title: "Conversion", subtitle: "a RATIO rendered as a percentage — `P` multiplies by 100, exactly as it does in C#",
                labels: months, height: 200) {
            Line(label: "Conversion", values: ratio);
            Axis(side: AxisSide.Left, format: "P0", ticks: 4);
          }
        }
      }

      Panel(title: "Horizontal bars",
            note: "The transpose, and the right form whenever the category NAMES are long: \"Enterprise renewals\" "
                + "fits beside a bar and does not fit under a column. A `Bar` flips the whole chart — the value axis "
                + "moves to the bottom, the categories run down the left, the gridlines stand up — so `Axis(side: "
                + "Bottom)` is the VALUE axis here, which is where the numbers actually are.") {
        Stack(gap: 5) {
          Chart(title: "Pipeline by segment", subtitle: "one series, values on the marks", labels: segments,
                height: 240, showValues: true) {
            Bar(label: "Pipeline", values: pipeline);
            Axis(side: AxisSide.Bottom, title: "GBP", format: "N0", prefix: "£", ticks: 4);
          }
          Chart(title: "Against last year", subtitle: "two bar series share each row, exactly as two columns share a slot",
                labels: segments, height: 280) {
            Bar(label: "This year", values: pipeline);
            Bar(label: "Last year", values: lastYear);
            Axis(side: AxisSide.Bottom, format: "N0", prefix: "£", ticks: 4);
          }
        }
      }

      Panel(title: "Stacked",
            note: "Grouped and stacked answer different questions. Grouped compares series AT a category; stacked "
                + "compares the TOTAL across categories and shows what made it up. The cost is that every series "
                + "except the bottom one loses its baseline, which is why grouped stayed the default — `stacked: "
                + "true` is a choice about the question, not a style.") {
        Stack(gap: 5) {
          Chart(title: "Revenue by channel", subtitle: "the stack total is what the axis measures",
                labels: months, height: 260, stacked: true, showValues: true) {
            Column(label: "Direct", values: revenue);
            Column(label: "Partner", values: target);
            Axis(side: AxisSide.Left, format: "N0", prefix: "£", ticks: 4);
            Legend(position: LegendPos.Bottom, interactive: true);
          }
          Chart(title: "Pipeline composition", subtitle: "the same rule, transposed — a stacked BAR",
                labels: segments, height: 240, stacked: true) {
            Bar(label: "This year", values: pipeline);
            Bar(label: "Last year", values: lastYear);
            Axis(side: AxisSide.Bottom, format: "N0", prefix: "£", ticks: 4);
          }
        }
      }

      Panel(title: "Pie, donut, and one slice pulled out",
            note: "Parts of one thing — the statement a pie makes better than a bar chart, and the only one it "
                + "makes well. The legend carries the value AND the share because reading either off the angles is "
                + "exactly what people cannot do. `Slice(explode: true)` pulls ONE wedge out: exploding all of them "
                + "is the spreadsheet default and says nothing.") {
        Row(gap: 5, wrap: Wrapping.Wrap) {
          Pie(title: "Revenue by channel", subtitle: "a pie", size: 200, format: "N0", prefix: "£") {
            Slice(label: "Direct", value: 184000.0);
            Slice(label: "Partner", value: 121000.0);
            Slice(label: "Self-serve", value: 76000.0);
            Slice(label: "Reseller", value: 31000.0);
          }
          Pie(title: "Revenue by channel", subtitle: "a donut — `hole: 0.55` — with the total in the middle",
              size: 200, hole: 0.55, format: "N0", prefix: "£", centre: "£412K") {
            Slice(label: "Direct", value: 184000.0);
            Slice(label: "Partner", value: 121000.0);
            Slice(label: "Self-serve", value: 76000.0, explode: true);
            Slice(label: "Reseller", value: 31000.0);
          }
        }
      }

      Panel(title: "The legend is a control",
            note: "`Legend(position: Right, interactive: true)` — click a series to switch it off, click again to "
                + "bring it back. The SCALE follows: switch Revenue off and the axis drops from £80K to £8K so "
                + "Refunds fills the plot instead of hugging the floor. The COLOURS do not — a series keeps its "
                + "palette slot whether it is showing or not, so hiding one does not repaint the rest under a reader "
                + "who had learned what orange meant. Off by default, because a legend that looks clickable on a "
                + "chart nobody can click is a lie the reader has no way to detect.") {
        Chart(title: "Revenue and refunds", subtitle: "click a series in the legend", labels: months, height: 260) {
          Column(label: "Revenue", values: revenue);
          Line(label: "Refunds", values: refunds);
          Axis(side: AxisSide.Left, ticks: 4);
          Legend(position: LegendPos.Right, interactive: true);
        }
      }

      Panel(title: "Annotations",
            note: "Things that are true about the chart but are not in the data: a target, an acceptable range, the "
                + "day something happened. An annotation is NOT a series — no legend entry, no palette slot, and it "
                + "does not move the scale. Model a target as a flat one-value Line instead and you pay for all "
                + "three: the legend grows an entry nobody clicks, the palette shifts under the real series, and a "
                + "500K target would squash every real bar into the bottom eighth of the plot to make room for it.") {
        Chart(title: "Revenue against target", subtitle: "First half", labels: months, height: 280) {
          Column(label: "Revenue", values: revenue);
          Band(from: 55000.0, to: 65000.0, label: "Acceptable");
          Rule(value: 60000.0, label: "Target");
          Note(category: "May", value: 73000.0, label: "v2 launch");
          Axis(side: AxisSide.Left, ticks: 4);
        }
      }

      Panel(title: "An annotation label picks its own side",
            note: "The same note on the LAST category. Its label would run off the right edge and be clipped, so it "
                + "flips to the left of its dot — decided by measuring the string against the plot's real width, "
                + "which is a fact about this text at this size, not about the category index. The rule is clamped "
                + "for the same kind of reason: 120K is off the top of this chart, so the line pins to the ceiling "
                + "and its accessible name says \"above the top of this chart\" rather than pretending it was met.") {
        Chart(title: "Revenue", subtitle: "with a note on the last month", labels: months, height: 260) {
          Column(label: "Revenue", values: revenue);
          Note(category: "Jun", value: 69000.0, label: "Quarter close");
          Rule(value: 120000.0, label: "Stretch");
          Axis(side: AxisSide.Left, ticks: 4);
        }
      }

      Panel(title: "Annotations on a horizontal chart",
            note: "A rule always crosses the VALUE axis, so on a transposed chart it stands vertical and its label "
                + "goes on top — the same declaration, reflected, exactly like every other pair in this kit.") {
        Chart(title: "Pipeline by segment", labels: segments, height: 240) {
          Bar(label: "Pipeline", values: pipeline);
          Band(from: 100000.0, to: 150000.0, label: "Target range");
          Rule(value: 120000.0, label: "Target");
          Axis(side: AxisSide.Bottom, prefix: "£", format: "N0");
        }
      }

      Panel(title: "A note that names a category this chart does not have",
            note: "Categories are runtime data, so this cannot be a compile error — and a note that simply vanished "
                + "would be the worst of both worlds: a chart that renders perfectly and is missing the thing you "
                + "asked for, with nothing anywhere saying why. So the chart says it, in the same spirit as \"No "
                + "data to plot\".") {
        Chart(title: "Revenue", subtitle: "a note on a month that is not on this chart", labels: months, height: 200) {
          Column(label: "Revenue", values: revenue);
          Note(category: "Jul", value: 61000.0, label: "Summer push");
          Axis(side: AxisSide.Left, ticks: 3);
        }
      }

      Panel(title: "The same data as rows",
            note: "`Table()` puts the numbers under the picture; `Table(position: Instead)` replaces it. It is the "
                + "accessibility answer as much as the honest fallback — every mark already names itself, which is "
                + "right when you are ON that mark and useless for \"which month was highest?\". That question is "
                + "answered by structure, so the table is a real grid a screen reader can read by position and a "
                + "sighted reader can select and copy. It follows the legend: switch a series off and its column "
                + "leaves too, because a table that disagrees with the chart beside it is worse than no table.") {
        Stack(gap: 5) {
          Chart(title: "Revenue and refunds", subtitle: "chart and table, from one declaration", labels: months,
                height: 220) {
            Column(label: "Revenue", values: revenue);
            Line(label: "Refunds", values: refunds);
            Axis(side: AxisSide.Left, format: "N0", prefix: "£", ticks: 4);
            Legend(position: LegendPos.Bottom, interactive: true);
            Table();
          }
          Chart(title: "Pipeline by segment", subtitle: "five magnitudes that do not trend — a table is the right shape",
                labels: segments) {
            Bar(label: "Pipeline", values: pipeline);
            Axis(side: AxisSide.Bottom, format: "N0", prefix: "£");
            Table(position: TablePos.Instead);
          }
        }
      }

      Panel(title: "Sparklines — `chrome: Bare`",
            note: "Everything that is not a mark, taken away: no card, no axes, no gridlines, no legend, no visible "
                + "title, no hover readout. A mode rather than a second component, because a sparkline is not a "
                + "different kind of picture — a separate `Sparkline` would be a second path through the same marks "
                + "and the two would drift. The title is not dropped, it MOVES: it becomes the accessible name, so "
                + "each row below still announces itself to a screen reader while drawing no heading.") {
        SparkTable(labels: months, rows: [
          new SparkMetric { Name = "Revenue", Values = revenue, Prefix = "£", Format = "N0" },
          new SparkMetric { Name = "Refunds", Values = refunds, Prefix = "£", Format = "N0" },
          new SparkMetric { Name = "Churn",   Values = churn,   Suffix = " %", Format = "N1" },
        ]);
      }

      Panel(title: "The axis measures every label, not the longest one by character count",
            note: "The trap in one axis: \"iiiiiiiiiiii\" is twelve characters and paints ~40px; \"WWWWW\" is five "
                + "characters and paints ~60px. An axis that picked its widest label by COUNTING CHARACTERS measures "
                + "the narrow one, believes it has room, and lets the wide ones collide. This one folds over every "
                + "label's painted width — `labels.Max(l => Layout.TextWidth(l) ?? …)`, ordinary C# LINQ, which was "
                + "refused inside a query clause until a clause over a local list was told apart from one that "
                + "becomes SQL.") {
        Box(w: 400) {
          Chart(title: "Mixed labels", subtitle: "in a 400px box", labels: mixedLabels, height: 120) {
            Column(label: "n", values: sixOnes);
          }
        }
      }

      Panel(title: "The empty state",
            note: "A chart with no marks says so. A blank plot frame reads as \"loading\" forever, which is the "
                + "state a dashboard is actually in most often.") {
        Chart(title: "Awaiting data", height: 160);
      }
    }
  }
}

/// ONE METRIC IN THE SPARKLINE TABLE — its name, its numbers, and how to render them.
public class SparkMetric {
  public string Name;
  public double[] Values;
  public string Prefix = "";
  public string Suffix = "";
  /// A.NET format string, spelled the way C# spells it — `"N0"`, `"N1"`.
  public string Format = "N0";
}

/// A METRICS TABLE WITH A SPARKLINE COLUMN — the form sparklines were invented for.
[AllowAnonymous]
[Composable]
component SparkTable(string[] labels, SparkMetric[] rows) {
  render {
    Stack(gap: 0, role: UiRole.Grid, label: "Metrics") {
      Row(py: 2, gap: 4, borderBW: 1, border: "#D9DEE5", role: UiRole.GridRow) {
        Box(w: 110, shrink: 0, role: UiRole.ColumnHeader) { Text("Metric", fontSize: "12px", fontWeight: "600", color: "#5B6472"); }
        Row(w: 90, shrink: 0, justify: Justify.End, role: UiRole.ColumnHeader) { Text("Latest", fontSize: "12px", fontWeight: "600", color: "#5B6472"); }
        Row(w: 90, shrink: 0, justify: Justify.End, role: UiRole.ColumnHeader) { Text("Change", fontSize: "12px", fontWeight: "600", color: "#5B6472"); }
        Box(w: 200, shrink: 0, role: UiRole.ColumnHeader) { Text("Trend", fontSize: "12px", fontWeight: "600", color: "#5B6472"); }
        Box(w: 200, shrink: 0, role: UiRole.ColumnHeader) { Text("By month", fontSize: "12px", fontWeight: "600", color: "#5B6472"); }
      }
      foreach (var m in rows) {
        Row(py: 2, gap: 4, align: Align.Center, borderBW: 1, border: "#EDEFF2", role: UiRole.GridRow) {
          Box(w: 110, shrink: 0, role: UiRole.GridCell) { Text(m.Name, fontSize: "13px"); }
          Row(w: 90, shrink: 0, justify: Justify.End, role: UiRole.GridCell) {
            Text(Money(m, m.Values.Last()), fontSize: "13px", fontVariant: FontVariant.TabularNums);
          }
          Row(w: 90, shrink: 0, justify: Justify.End, role: UiRole.GridCell) {
            Text(Delta(m), fontSize: "13px", fontVariant: FontVariant.TabularNums,
                 color: m.Values.Last() >= m.Values[0] ? "#008300" : "#e34948");
          }
          Box(w: 200, h: 28, shrink: 0, role: UiRole.GridCell) {
            Chart(title: m.Name, labels: labels, height: 28, chrome: ChartChrome.Bare) {
              Line(label: m.Name, values: m.Values);
            }
          }
          Box(w: 200, h: 28, shrink: 0, role: UiRole.GridCell) {
            Chart(title: m.Name, labels: labels, height: 28, chrome: ChartChrome.Bare) {
              Column(label: m.Name, values: m.Values);
            }
          }
        }
      }
    }
  }
}

/// One value in this metric's own units.
string Money(SparkMetric m, double v) { return m.Prefix + v.ToString(m.Format) + m.Suffix; }

/// The move across the window, signed, with the arrow that carries it without colour.
string Delta(SparkMetric m) {
  var d = m.Values.Last() - m.Values[0];
  var arrow = d >= 0.0 ? "\u2191" : "\u2193";
  var mag = d >= 0.0 ? d : 0.0 - d;
  return arrow + " " + m.Prefix + mag.ToString(m.Format) + m.Suffix;
}
model/pages/live.osy85 lines
// A CHART BOUND TO A LIVE QUERY — the thing a dashboard actually is.

using Osyrin.Charts;

[Page("/live")]
[Render(CSR)]
[AllowAnonymous]
[Title("Live query")]
component Live() {
  live var readings = Reading.OrderBy(r => r.Slot).ToList();

  live var north  = SeriesValues(readings, "North");
  live var south  = SeriesValues(readings, "South");
  live var slots  = SlotLabels(readings);
  live var count  = readings.Count;

  int tick = 0;

  on mount { SeedReadings(); }

  action Append() {
    tick = tick + 1;
    AppendReading(
      18.0 + Math.Sin((double)tick * 0.9) * 9.0 + (double)tick * 0.8,
      14.0 + Math.Cos((double)tick * 0.7) * 7.0 + (double)tick * 1.1);
  }

  action Reset() {
    tick = 0;
    ResetReadings();
  }

  render {
    DemoPage(title: "Live query", here: "/live") {
      Panel(title: "The chart follows the rows",
            note: "Press Append. Nothing below tells the chart to redraw — a `live var` tracks the query, the "
                + "series arrays derive from it, and the marks take arrays. Open a second window to watch the "
                + "subscription rather than a local re-render.") {
        Stack(gap: 4) {
          Row(gap: 3, align: Align.Center, wrap: Wrapping.Wrap) {
            Pressable("Append a reading", onClick: Append);
            Pressable("Reset", onClick: Reset);
            Text($"{count} rows", fontSize: FontSize.Small, color: Colors.Muted);
          }

          Chart(title: "Sensor readings", subtitle: "Two series, live", labels: slots, height: 300) {
            Line(label: "North", values: north);
            Line(label: "South", values: south);
            Axis(side: AxisSide.Left, ticks: 4);
          }
        }
      }

      Panel(title: "The same data, as columns",
            note: "One query, two charts, no coordination between them. Both are derived from `readings`, so they "
                + "cannot disagree about what the data is — which is the failure mode a dashboard that refreshes "
                + "each widget independently has by construction.") {
        Chart(title: "Sensor readings", labels: slots, height: 220) {
          Column(label: "North", values: north);
          Column(label: "South", values: south);
          Axis(side: AxisSide.Left, ticks: 3);
        }
      }
    }
  }
}

/// The values of ONE series, in slot order.
double[] SeriesValues(Reading[] rows, string series) {
  var out = new List<double>();
  foreach (var r in rows) {
    if (r.Series == series) { out.Add(r.Value); }
  }
  return out.ToArray();
}

/// One label per slot — the category axis for however many readings exist right now.
string[] SlotLabels(Reading[] rows) {
  var out = new List<string>();
  foreach (var r in rows) {
    if (r.Series == "North") { out.Add(Convert.ToString(r.Slot + 1)); }
  }
  return out.ToArray();
}
model/pages/palette.osy89 lines
// THE PALETTE, RENDERED — all eight series slots at once.

using Osyrin.Charts;

[Page("/palette")]
[Render(CSR)]
[AllowAnonymous]
[Title("The palette")]
component Palette() {
  string[] steps = ["1", "2", "3", "4", "5", "6", "7", "8", "9", "10", "11", "12"];

  double[] s1 = Ramp(1);
  double[] s2 = Ramp(2);
  double[] s3 = Ramp(3);
  double[] s4 = Ramp(4);
  double[] s5 = Ramp(5);
  double[] s6 = Ramp(6);
  double[] s7 = Ramp(7);
  double[] s8 = Ramp(8);

  render {
    DemoPage(title: "The palette", here: "/palette") {
      Panel(title: "Eight series as LINES",
            note: "2px of stroke is the thinnest the palette ever has to work at, and the hardest. Adjacent slots "
                + "are the pairs to look at — the order is fixed and never cycled, so slot 4 always sits beside "
                + "slots 3 and 5.") {
        Chart(title: "All eight slots", subtitle: "In fixed palette order", labels: steps, height: 320) {
          Line(label: "Slot 1", values: s1);
          Line(label: "Slot 2", values: s2);
          Line(label: "Slot 3", values: s3);
          Line(label: "Slot 4", values: s4);
          Line(label: "Slot 5", values: s5);
          Line(label: "Slot 6", values: s6);
          Line(label: "Slot 7", values: s7);
          Line(label: "Slot 8", values: s8);
          Axis(side: AxisSide.Left, ticks: 4);
        }
      }

      Panel(title: "Eight series as COLUMNS",
            note: "The same eight hues as filled area, side by side and touching. A pair that separates as a 2px "
                + "line can still merge as a block, which is why both are here — and this is also the grouped-column "
                + "path at its widest, eight series sharing one category slot.") {
        Chart(title: "All eight slots", labels: ["Series colours"], height: 260) {
          Column(label: "Slot 1", values: [9.0]);
          Column(label: "Slot 2", values: [9.0]);
          Column(label: "Slot 3", values: [9.0]);
          Column(label: "Slot 4", values: [9.0]);
          Column(label: "Slot 5", values: [9.0]);
          Column(label: "Slot 6", values: [9.0]);
          Column(label: "Slot 7", values: [9.0]);
          Column(label: "Slot 8", values: [9.0]);
          Axis(side: AxisSide.Left, ticks: 3, grid: false);
        }
      }

      Panel(title: "The ninth series",
            note: "There isn't one. Past eight, hues stop being distinguishable long before slots run out, so the "
                + "tail SHARES the last slot rather than being handed a generated colour — the chart is telling you "
                + "to group or facet. The top two lines below are the 8th and 9th series and they are the SAME hue; "
                + "the legend is what keeps them tellable apart.") {
        Chart(title: "Nine series", labels: steps, height: 300) {
          Line(label: "Slot 1", values: s1);
          Line(label: "Slot 2", values: s2);
          Line(label: "Slot 3", values: s3);
          Line(label: "Slot 4", values: s4);
          Line(label: "Slot 5", values: s5);
          Line(label: "Slot 6", values: s6);
          Line(label: "Slot 7", values: s7);
          Line(label: "Slot 8", values: s8);
          Line(label: "Slot 9 — shares slot 8's hue", values: Ramp(9));
          Axis(side: AxisSide.Left, ticks: 4);
        }
      }
    }
  }
}

/// A gently rising series offset by its slot, so eight of them stack without ever touching.
double[] Ramp(int slot) {
  var out = new List<double>();
  var i = 0;
  while (i < 12) {
    out.Add((double)slot * 10.0 + Math.Sin((double)i * 0.7) * 2.5 + (double)i * 0.4);
    i = i + 1;
  }
  return out.ToArray();
}
model/pages/time.osy71 lines
// THE TIME AXIS — and first, honestly, what a time series looks like WITHOUT one.

using Osyrin.Charts;

/// The mean of the `n` values ending at `i` — a moving average, and an ordinary function.
double Avg(double[] xs, int i, int n) {
  var from = i - n + 1 < 0 ? 0 : i - n + 1;
  var sum = 0.0;
  var k = from;
  while (k <= i) { sum = sum + xs[k]; k = k + 1; }
  return sum / (double)(i - from + 1);
}

[Page("/time")]
[Render(CSR)]
[AllowAnonymous]
[Title("Time axis")]
component TimeDemo() {
  live var days   = Enumerable.Range(0, 60).ToArray();
  live var labels = days.Select(d => DateTime.Parse("2026-03-02T00:00:00Z").AddDays(d).ToString("dd MMM")).ToArray();
  live var price  = days.Select(d => 100.0 + 18.0 * Math.Sin((double)d / 7.0) + 0.55 * (double)d).ToArray();

  live var closes = price;
  live var opens  = days.Select(d => 100.0 + 18.0 * Math.Sin(((double)d - 1.0) / 7.0) + 0.55 * ((double)d - 1.0)).ToArray();
  live var highs  = days.Select(d => Math.Max(closes[d], opens[d]) + 1.0 + 2.5 * Math.Abs(Math.Sin((double)d * 1.7))).ToArray();
  live var lows   = days.Select(d => Math.Min(closes[d], opens[d]) - 1.0 - 2.5 * Math.Abs(Math.Cos((double)d * 2.3))).ToArray();
  live var ma10   = days.Select(d => Avg(closes, d, 10)).ToArray();

  double[] dOpen  = [104.0, 106.5, 105.2, 108.9, 112.4, 111.0, 111.0, 107.6, 109.8, 113.2, 116.0, 114.3];
  double[] dClose = [106.4, 105.1, 108.7, 112.6, 111.2, 111.0, 107.9, 109.6, 113.4, 115.8, 114.1, 118.9];
  double[] dHigh  = [107.1, 107.8, 109.3, 113.4, 113.9, 111.8, 111.6, 110.2, 113.9, 117.4, 116.8, 119.6];
  double[] dLow   = [103.2, 104.4, 104.6, 108.1, 110.6, 110.2, 107.1, 106.9, 109.1, 112.7, 113.4, 113.8];

  render {
    DemoPage(title: "Time axis", here: "/time") {
      Panel(title: "Sixty days, on the CATEGORY axis the kit ships today",
            note: "Every category gets a label and an equal share of the width. Right for six months; at sixty days "
                + "the labels collide into a grey band and the chart stops having an x axis at all.") {
        Chart(title: "Price", subtitle: "60 sessions", labels: labels, height: 280) {
          Line(label: "Close", values: price);
          Axis(side: AxisSide.Left, ticks: 4, prefix: "$");
        }
      }

      Panel(title: "Candlesticks — open, high, low, close",
            note: "Four numbers per session and ONE object per session: the body spans open to close, the wick low "
                + "to high. Direction is TWO channels — hollow/green up, filled/red down — because colour alone is "
                + "not a channel for a reader with a colour-vision deficiency or a greyscale print. The moving "
                + "average is an ordinary Line on the same scale, which is the whole reason a candle is a MARK "
                + "rather than a chart of its own.") {
        Chart(title: "ACME", subtitle: "60 sessions", labels: labels, height: 320) {
          Candle(label: "ACME", values: closes, opens: opens, highs: highs, lows: lows);
          Line(label: "MA10", values: ma10);
          Axis(side: AxisSide.Left, ticks: 5, prefix: "$");
          Legend(position: LegendPos.Bottom);
        }
      }

      Panel(title: "Twelve sessions, values on",
            note: "The same marks at a size where each session is readable. A doji — a session that opened and "
                + "closed at the same price — still draws a body: a 1px floor, because 0% paints nothing and reads "
                + "as missing data rather than as an unchanged price.") {
        Chart(title: "ACME", subtitle: "Last twelve", labels: labels.Take(12).ToArray(), height: 260) {
          Candle(label: "ACME", values: dClose, opens: dOpen, highs: dHigh, lows: dLow);
          Axis(side: AxisSide.Left, ticks: 4, prefix: "$");
        }
      }
    }
  }
}